|
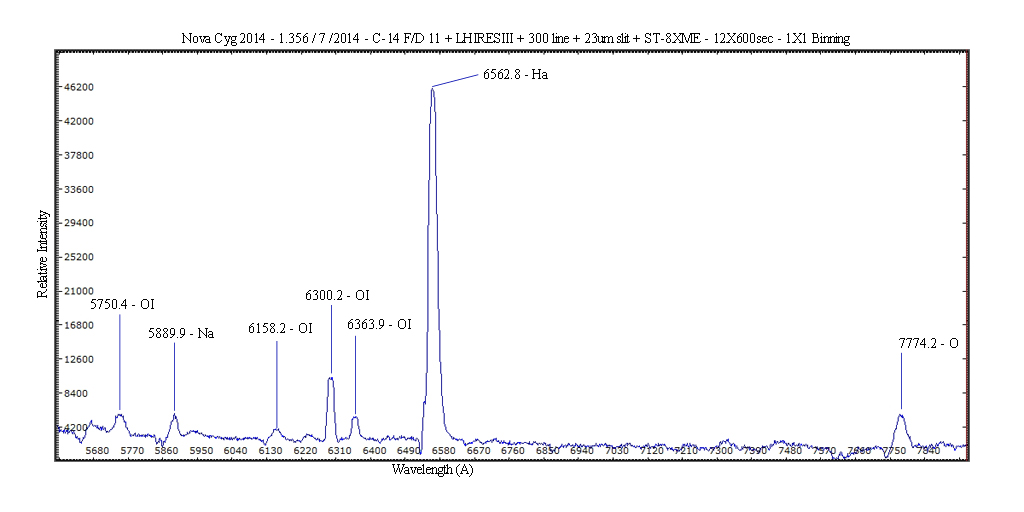
Below is one night of imaging. A total of 12 images, 600 seconds long were processed, combine, and, calibrated to obtain the final graph. The strong emission
lines of Ha=hydrogen alpha, NA=sodium , OI - (common in Fe novae), and O=Oxygen are visible. Below the graph is the combined raw spectra images as the camera sees it. Then the emission and absorption lines of the entire
range. As I process the additional nights of data collection I will update the page to show the changes in the novas output. Hopefully I will learn how to understand the results. |
