How I Started
Home
Kevin's story
Images
Spectroscopy
The Equipment
The Observatory
Remote Sites
Books
Web Links

For many years fellow amateur astronomer Dale Mais had tried to move me into the direction of science with my telescopes.  In May of 2005, I attended my first Society for Astronomical Sciences (SAS) annual meeting in Big Bear, California.  While I attended, I met numerous people engaged in research projects that were way over my head.  But everyone I talked to was overwhelmingly  friendly, and recommended on become part of the SAS group.  During that trip I met Alan Holmes of Santa Barbara Instrument Group (SBIG).  SBIG had just started producing a entry-level deep-sky spectrograph called the DSS-7.  Through Dales good friendship with Alan, I was loaned a DSS-7 spectrograph and a ST-402ME camera for 30 days.  During this 30 day period, my project was to learn the DSS-7/ST-402ME operation and to collect spectral image data of the NASA Deep Impact mission of Comet Temple 1 on July 8, 2005.  Oh, if that wasn't enough, lets try to do the same of the newly discovered supernovae SN2005cf.

Well I received a lesson on how difficult it was to obtain usable data.  I had hardware problems, tracking problems, and just plain old being on a learning curve with a new piece of equipment and new software to obtain the images.

How I Started
The Equipment
Eclipsing Binaries
Be Stars
Nova/Supernova
Wolf-Rayet Stars
Carbon Stars

Above is the setup I used to collect the spectra data.  I used the 14-inch telescope with the DSS-7/ST-402ME and I tried a ST-5C as an auto guider (which was a failure).  One problem with trying to collect data about a comet is that it is quickly moving across the sky while you're trying to image it.  Then it is very faint in brightness.  Next the sky glow from the light pollution in near by San Diego is overwhelming to your data if you are learning how to deal with it for the first time.  Finally, there is only a small 20 micron slit in the spectrograph to image through.  The DSS-7 was made to do spectra on bright and large objects like nebula and galaxies.  Hence the name "deep sky spectrograph".  So I was pushing the DSS-7 to see if this even could be done.

Above are three full frame images of comet Temple 1.  The upper left was a test image taken prior to the Deep Impact event.  Upper right was an image at impact, and the lower image is just after the impact.  You can see the increase in brightness due to the impact from the NASA projectile that hit the comet.  The small white border rectangle was the reference for the  20 micron slit opening in the DSS-7.  This is were I had to keep the comet.  I had to repeatedly move the telescope ahead of the comet so it could drift across the slit during a 300 second exposure.  But now looking back, I should have rotated the DSS-7 to have the comet track long the slit.  Needless to say, I captured more sky glow from San Diego than light from the comet.  After processing the image data, none of it was usable to create any spectral data, but I got a lot of good skyglow data.  A lot was learned from this adventure.  I also imaged supernovae SN2005cf and had similar poor results.  I had a long way to go to perfect spectroscopy technics.

In March 2009, I bought a used DSS-7 and ST-402ME and started to practice using the equipment in my spare time.  Once again I used the Celestron C-14 and image various galaxies, nebula, stars, and planets.  I used an old Celestron off-axis guider between the DSS-7 and the C-14 which I modified to flood the inlet of the DSS-7 with a neon lamp.  Here are some of the better graphs created with that setup and Visual Spec below.  The numbers accross the bottom of the grapgh is the spectral wavelength.

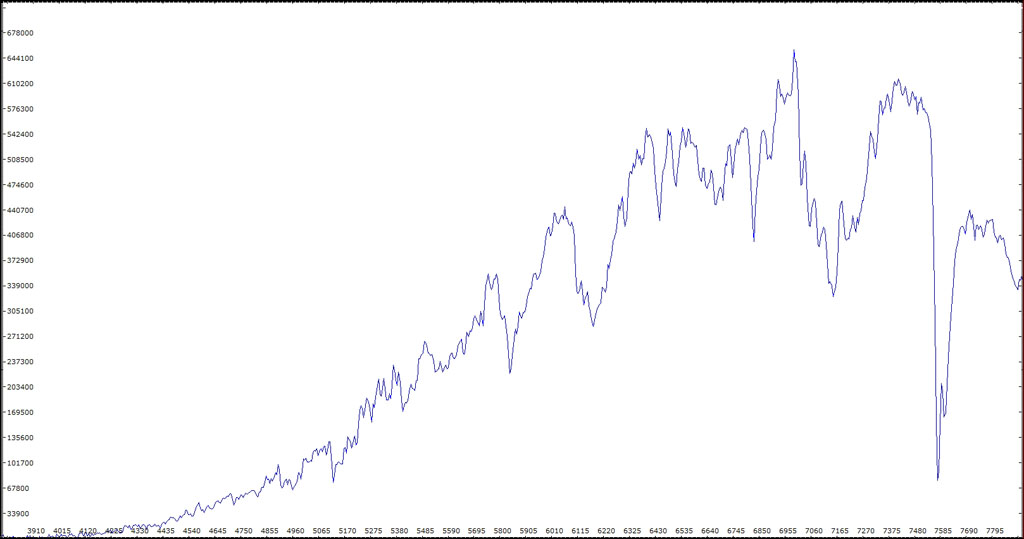
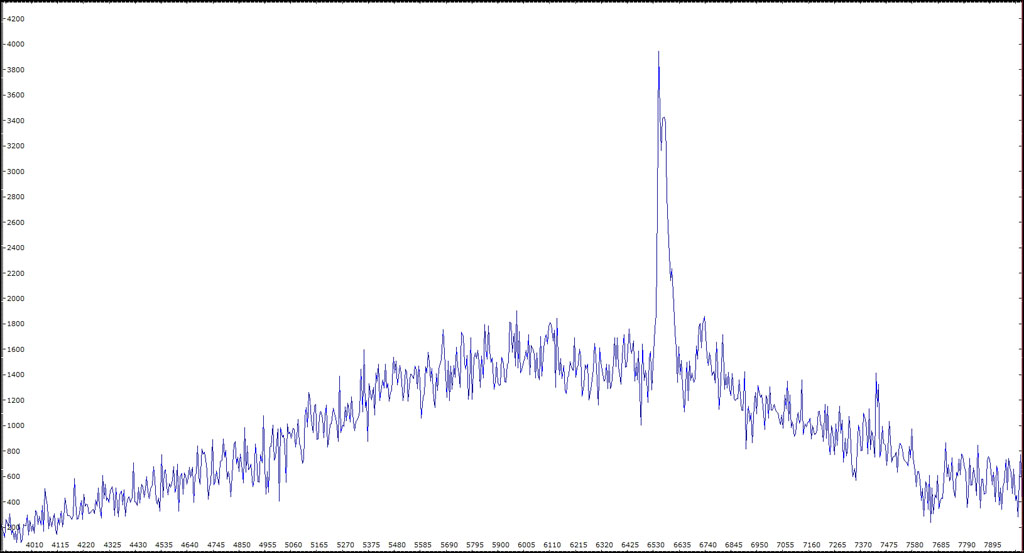
The star Antares, 50 micron slit, 2-second exposure.

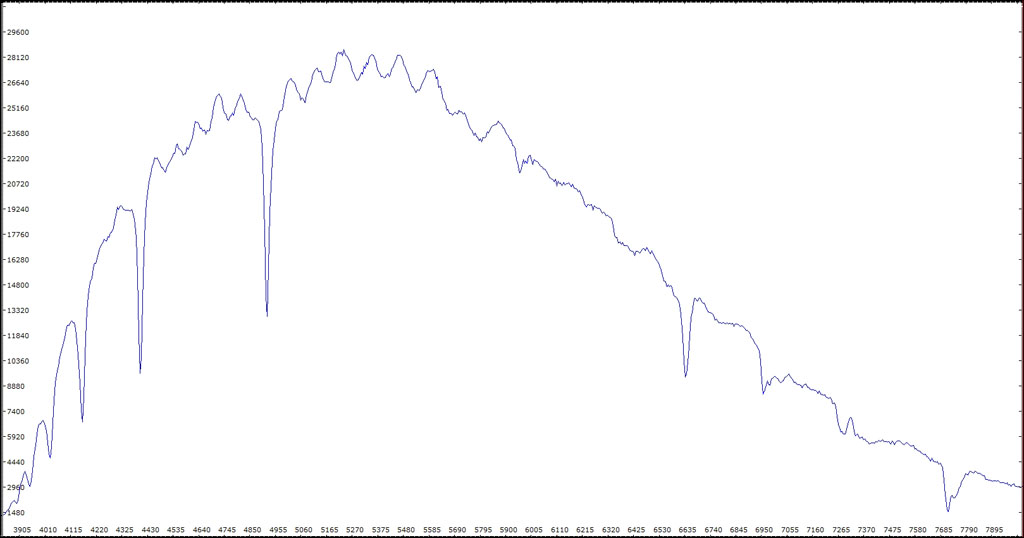
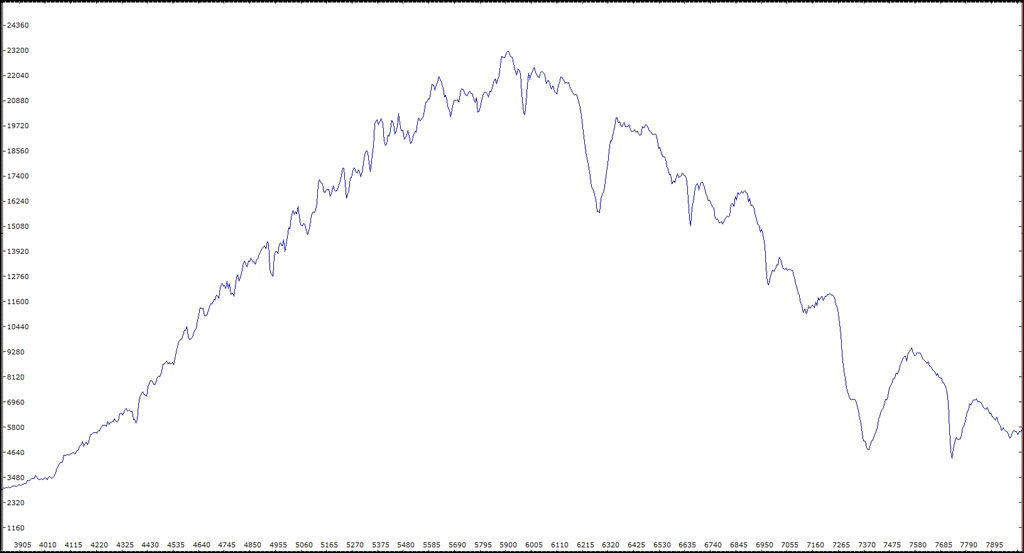
The star Vega, 50 micron slit, 2-second exposure.

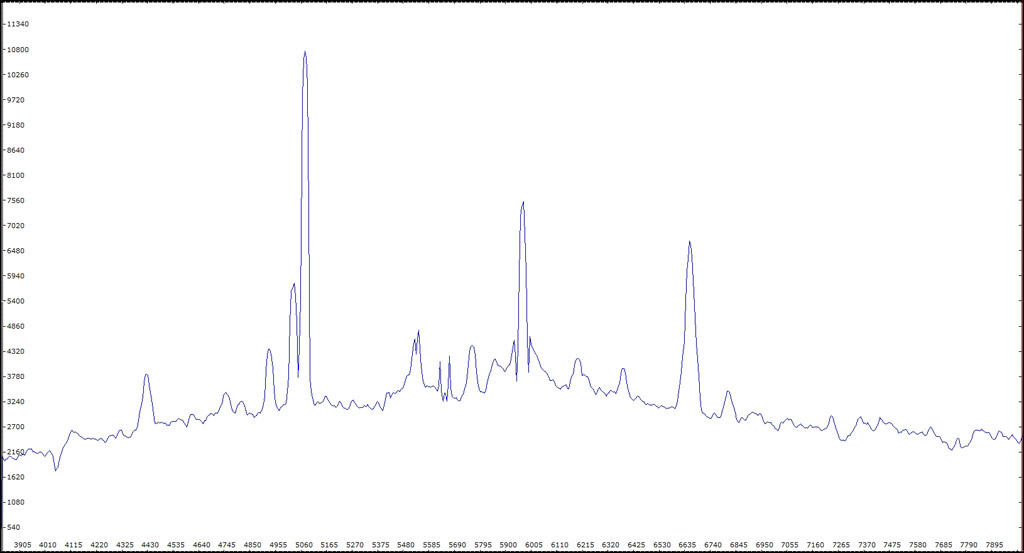
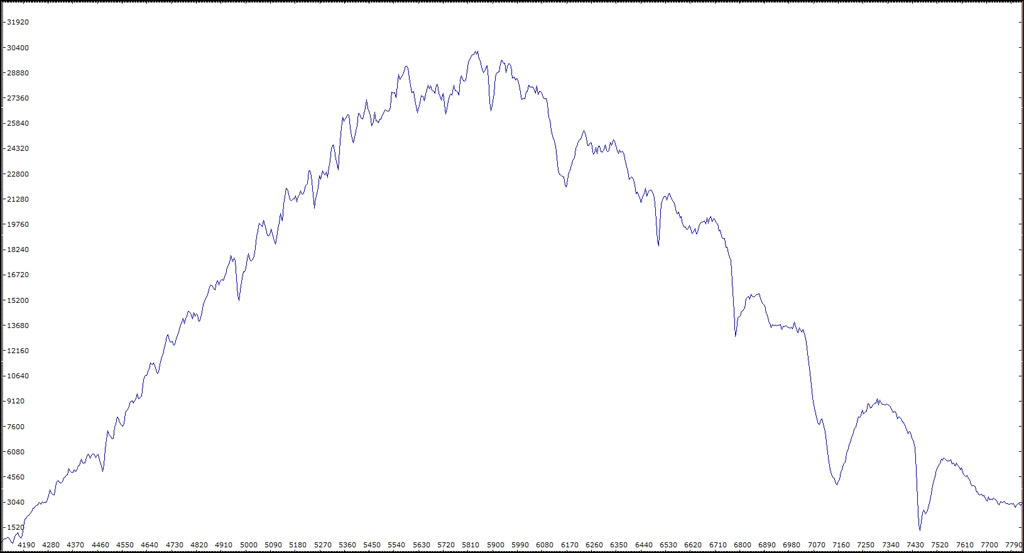
The Dumbell Nebula M27, 100 micron slit, 900-second exposure.

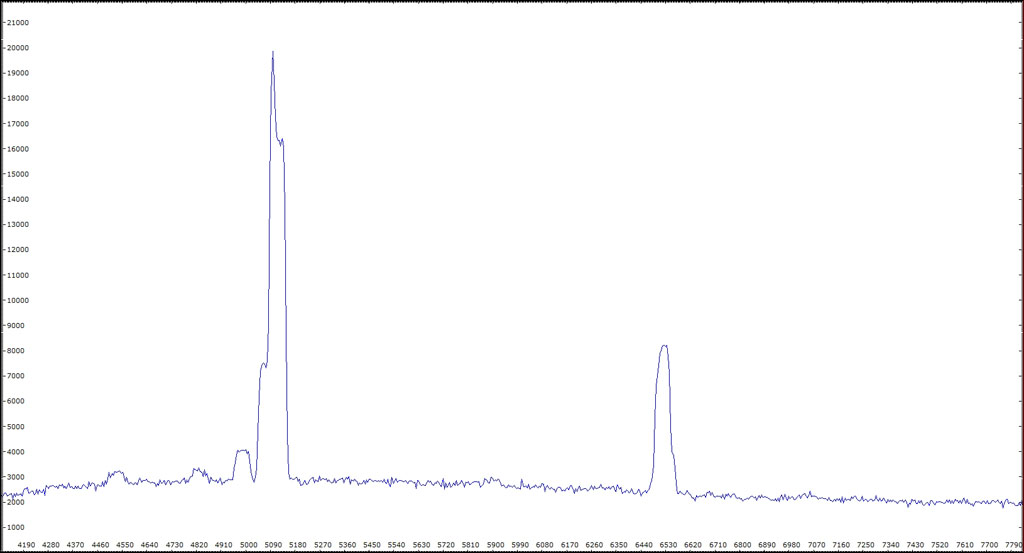
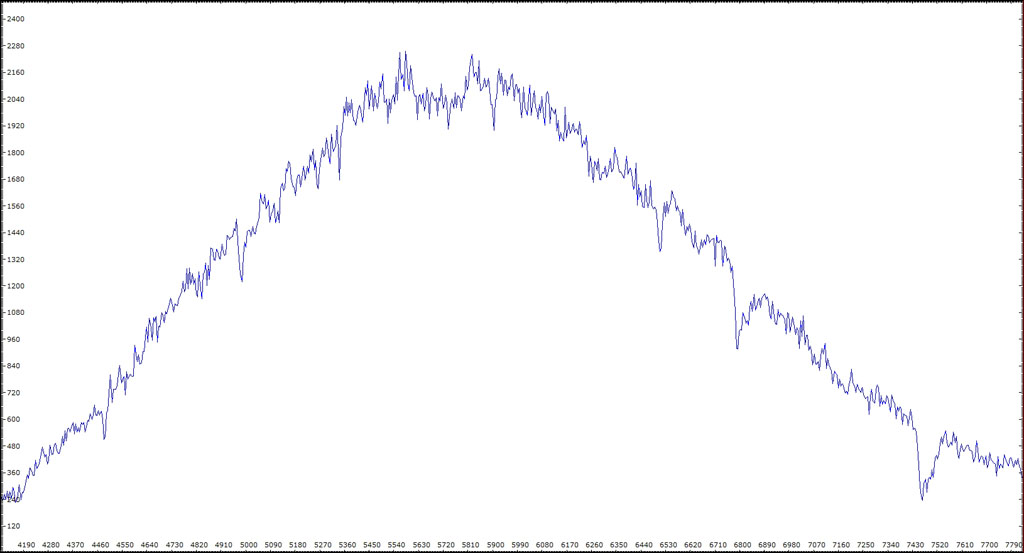
The Orion Nebula M42, 100 micron slit, 20-second exposure.

The Eskimo Nebula NGC2392, 100 micron slit, 20-second exposure.

The Galaxy M82, 200 micron slit, combination of three 60-second exposure.

The Planet Saturn, 50 micron slit, 1-second exposure.

The Planet Jupiter, 50 micron slit, 0.1-second exposure.

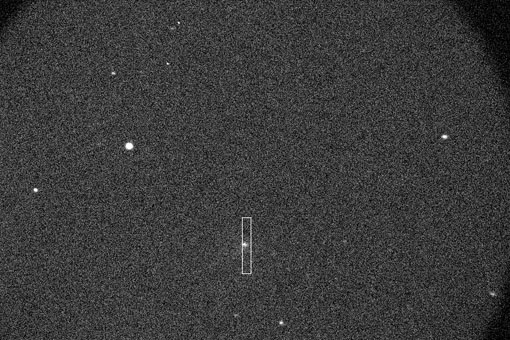
The moon of planet Jupiter, Callisto, 50 micron slit, 2-second exposure.


All of the above graphs were calibrated with neon gas emission lamp .  No bias subtraction, flat fielding or atmosphere water correction was including in the processing.  This was my first round of data collection with a lower resolution spectrograph.  In May 2010, I sold the DSS-7 and purchase a used Lhires III spectrograph with 150, 300, 600, 1200, and 2400 line gratings.  I have a ST-8XME for data collection and a ST-402XME for autoguiding.  That will be the next challenge and the next phase of data collecting.


BACK TO THE TOP

All the images in this site are © Copyright 1999 to Infinity by Kevin Hearst.
Commercial use of these images without the prior written consent or knowledge of the author is strictly prohibited..